Just a quick tip for profiling your custom code in Sitecore.
Over the years I have seen many different approaches used for measuring and logging the time it takes to execute a block of code. Many of these quite unnecessary since Sitecore already has this functionality built in.
Sitecore has a lot of very useful methods for this in the Sitecore.Diagnostics namespace which unfortunately I seldom see used by partners.
There is one approach in particular that I’m using quite a lot when creating new pipeline processors etc. That is to use the ProfileSection class.
  public class ProfileTestProcessor : HttpRequestProcessor
  {
    public override void Process(HttpRequestArgs args)
    {
      using (new ProfileSection("Doing some work.."))
      {
        DoSomeWork();
      }
    }

    private void DoSomeWork()
    {
      var item = Factory.GetDatabase("master").GetItem("/sitecore/content");
      // Don't do this
      var descendants = item.Axes.GetDescendants();
      foreach (var descendant in descendants)
      {
        Log.Info(descendant.Name, this);
      }
    }
  }
Note that a Profiler session is only started if the SiteContext is in debug mode. This of course also implies that the ProfileSection does not work until the SiteContext has been resolved by the SiteResolver in httpRequestBegin. So in short profiling is only possible after site resolving everything which happens before is not part of the Sitecore debug profile.
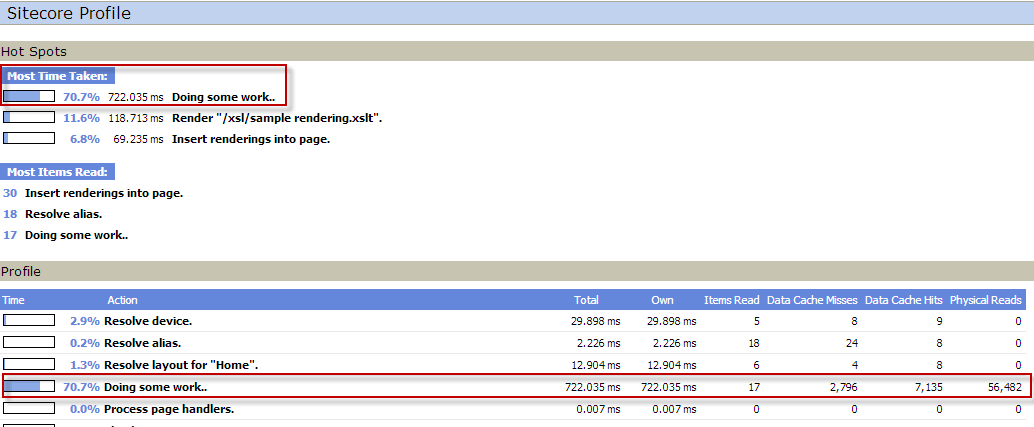
Now when running the Debugger we can see how much time was spend on running this code, how many items was read, and cache utilization compared with physical reads:
The ProfileSection class is actually just a smart wrapper which makes profiling easy to read in code. Alternately you can just do as follows:
    public override void Process(HttpRequestArgs args)
    {
      Profiler.StartOperation("Do some work..");
      DoSomeWork();
      Profiler.EndOperation();
    }
Here the danger is to forget to stop the profiling again and it is not as easy to read compared with the using block.